
Sector Rotation Stalls, Tech Remains King
Despite a slight rise in the S&P 500 over the past week, the sector rotation landscape presents an intriguing picture. For the first time in recent memory, there have been no changes in the composition of sector rankings — not only in the top five but across the board. This rare stability raises the question: could it mark the beginning of a new phase of stronger, more defined relative strength trends and a return to portfolio outperformance?
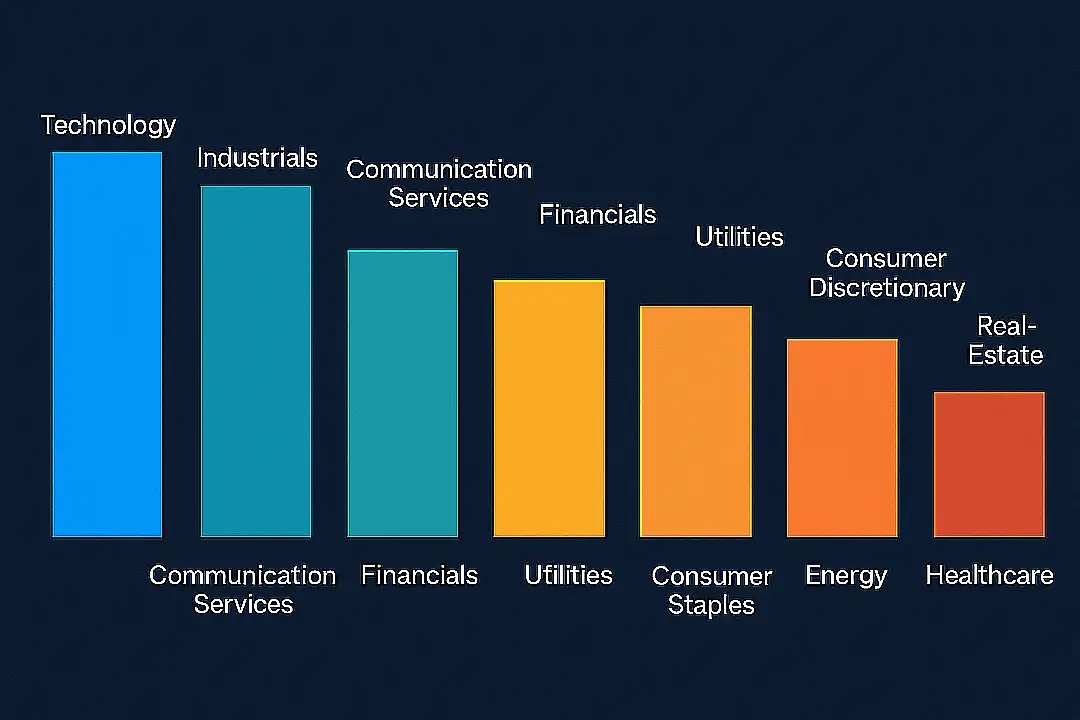
Current Sector Rankings
- Technology (XLK)
- Industrials (XLI)
- Communication Services (XLC)
- Financials (XLF)
- Materials (XLB)
- Utilities (XLU)
- Consumer Discretionary (XLY)
- Consumer Staples (XLP)
- Real Estate (XLRE)
- Energy (XLE)
- Healthcare (XLV)
Technology
The technology sector continues to dominate, climbing higher on the price ratio scale while maintaining stable momentum around 103. This sustained strength reaffirms that tech remains the leading sector in the current market environment.
On the daily RRG (Relative Rotation Graph), technology is showing renewed upward rotation even while inside the weakening quadrant — a sign of resilience that supports the weekly RRG reading. The raw relative strength (RS) line is rising sharply, indicating robust performance. Though momentum may have eased slightly, technology remains the strongest player on the field.
Industrials
Industrials are rotating out of the leading quadrant and appear on the verge of entering weakening territory. However, the sector still holds the second-highest rank based on the RS ratio, suggesting that a return to leadership is still possible.
On the daily RRG, industrials confirm their relative strength by moving further into the leading quadrant, rising on the RS ratio scale while maintaining steady momentum.
After breaking above overhead resistance, the price chart continues to trend higher. A new higher low on the relative strength line supports this positive structure. While the RS momentum line is slipping just above 100, maintaining higher highs and higher lows on the RS line could soon reverse this decline.
Communication Services
The communication services sector sits within the weakening quadrant on the weekly RRG and has drifted lower on the RS ratio scale, heading toward the lagging corner. This movement poses a risk to its top-five position.
On the daily RRG, communication services have already entered the lagging quadrant. Momentum appears to be slowing on the downside, but the sector will need a strong rotation back into the improving and leading quadrants to confirm a recovery.
The price chart shows the sector stabilizing after a prior breakout, with recent pullbacks finding support at former resistance levels — a healthy technical sign. However, the raw RS line has broken below its rising trendline, weighing on both RS ratio and momentum readings.
Financials
Financials remain inside the lagging quadrant on the weekly RRG, moving with a negative heading. To retain a top-five position, the sector will need significant improvement in relative strength.
On the price chart, financials are consolidating just below overhead resistance near the 52 level. A small pennant-like formation hints at potential for a breakout, but the relative strength chart does not yet confirm this view. The RS line has broken its rising trend and continues to move lower, signaling relative underperformance.
Materials
Materials also sit inside the lagging quadrant on the weekly RRG, mirroring the movement of financials with a negative trajectory. Continued weakness could threaten the sector’s position in the top five unless short-term momentum improves.
On the price chart, materials are attempting to stabilize after what resembles a head-and-shoulders reversal pattern. The RS line remains within a declining channel, closely following its falling resistance line. A decisive breakout from this pattern would be required to restore strength and turn the sector’s RRG lines upward.
Portfolio Performance
The portfolio currently trails the S&P 500 by roughly 8%. While this lag is not ideal, it appears to be stabilizing. Drawdowns in the range of 8–10% are not unprecedented based on historical backtests, but the timing is frustrating as the strategy transitions to a semi-live phase.
Still, the current period of stability after months of volatility may signal that the market is entering a new phase of steady relative trends. If so, this environment could pave the way for renewed portfolio outperformance in the weeks ahead.
Final Thoughts
Sector rotation appears to have paused, with no shifts in ranking across the major indices. Technology remains firmly in command, while Industrials and Communication Services hover near key inflection points. Financials and Materials show mixed signals but could rebound if relative momentum improves.
For now, patience and disciplined observation remain essential. Stable conditions often precede major moves — and if leadership trends reassert themselves, the coming weeks could mark the start of a new, more directional phase in sector performance.
#StayAlert and have a great week.
– Julius
